The Challenge
Instructors were manually grading Jamf 300 certification exams using a 20-sheet Excel workbook. For every student, they had to:
- Navigate through complex spreadsheet formulas to record 45 individual exam items
- Manually calculate scores and pass/fail status
- Copy-paste summary data into Salesforce
- Track why students failed specific items in disconnected notes
The pain points:
- Time consuming: 30 minutes per student × 600 students/year (40 classes × 15 students) = 300 hours of manual grading annually
- No analytics: Couldn't identify which exam items students struggle with most
- Version control nightmare: When rubrics changed, old Excel files became unreliable
- Data locked in spreadsheets: No way to export for statistical analysis or curriculum research
As the instructional designer responsible for the Jamf 300 course—and a doctoral candidate researching learning analytics—I needed this grading data to improve the curriculum. But more immediately, instructors needed a system that didn't make them dread Fridays. That is, exam day.
Note: This is a proof-of-concept application designed to demonstrate scalability across all Jamf instructor-led training (ILT) classes, not a production deployment.
My Approach
I decided to build a full-stack web application from scratch. And yet, this wasn't just about replacing Excel—it was about creating a learning analytics system that could evolve with the program.
Design Principles
- Make grading faster, not just digital. The interface had to be simpler than Excel, not just different.
- Capture the 'why,' not just the score. When students fail items, instructors need space to explain what went wrong.
- Support rubric evolution. Rubrics change ~5% annually. The system needed version control built in.
- Enable data-driven curriculum improvement. Every grading session is a data point for item analysis.
Technical Architecture Decisions
Frontend: Next.js 14 + TypeScript
I chose Next.js for server-side rendering and type safety. That is, the grading interface needed to feel fast and responsive—instructors shouldn't wait for pages to load between students.
Backend: FastAPI + Python
FastAPI gave me automatic API documentation, async support for database queries, and Python's data analysis libraries for future R exports. Since this system will eventually feed doctoral research, Python was the right choice.
Database: PostgreSQL 15
PostgreSQL handles the relational data—students, classes, rubric items—while also supporting JSON for flexible analytics queries. The rubric versioning system relies on foreign key constraints to maintain data integrity.
Infrastructure: Docker Compose
Three containers (frontend, backend, database) orchestrated together. Makes deployment simple: docker-compose up and everything just works.
The Solution
I built a complete web application with role-based access for three user types:
For Instructors: Streamlined Grading Interface
- Select class → Select student → Grade via 45-item checklist
- Items organized by exam section (Scenario 1, 2, 3, Practical)
- Real-time score calculation with pass/fail indicator (80% threshold)
- Add "Why?" explanations for any failed items
- One-click submission—grade saved and ready for Salesforce sync
For Learning Designers: Dynamic Rubric Management
- Add new exam items with automatic code generation
- Edit item text and point values
- Delete outdated items
- Automatic recalculation: When rubric totals change, all historical grades recalculate instantly
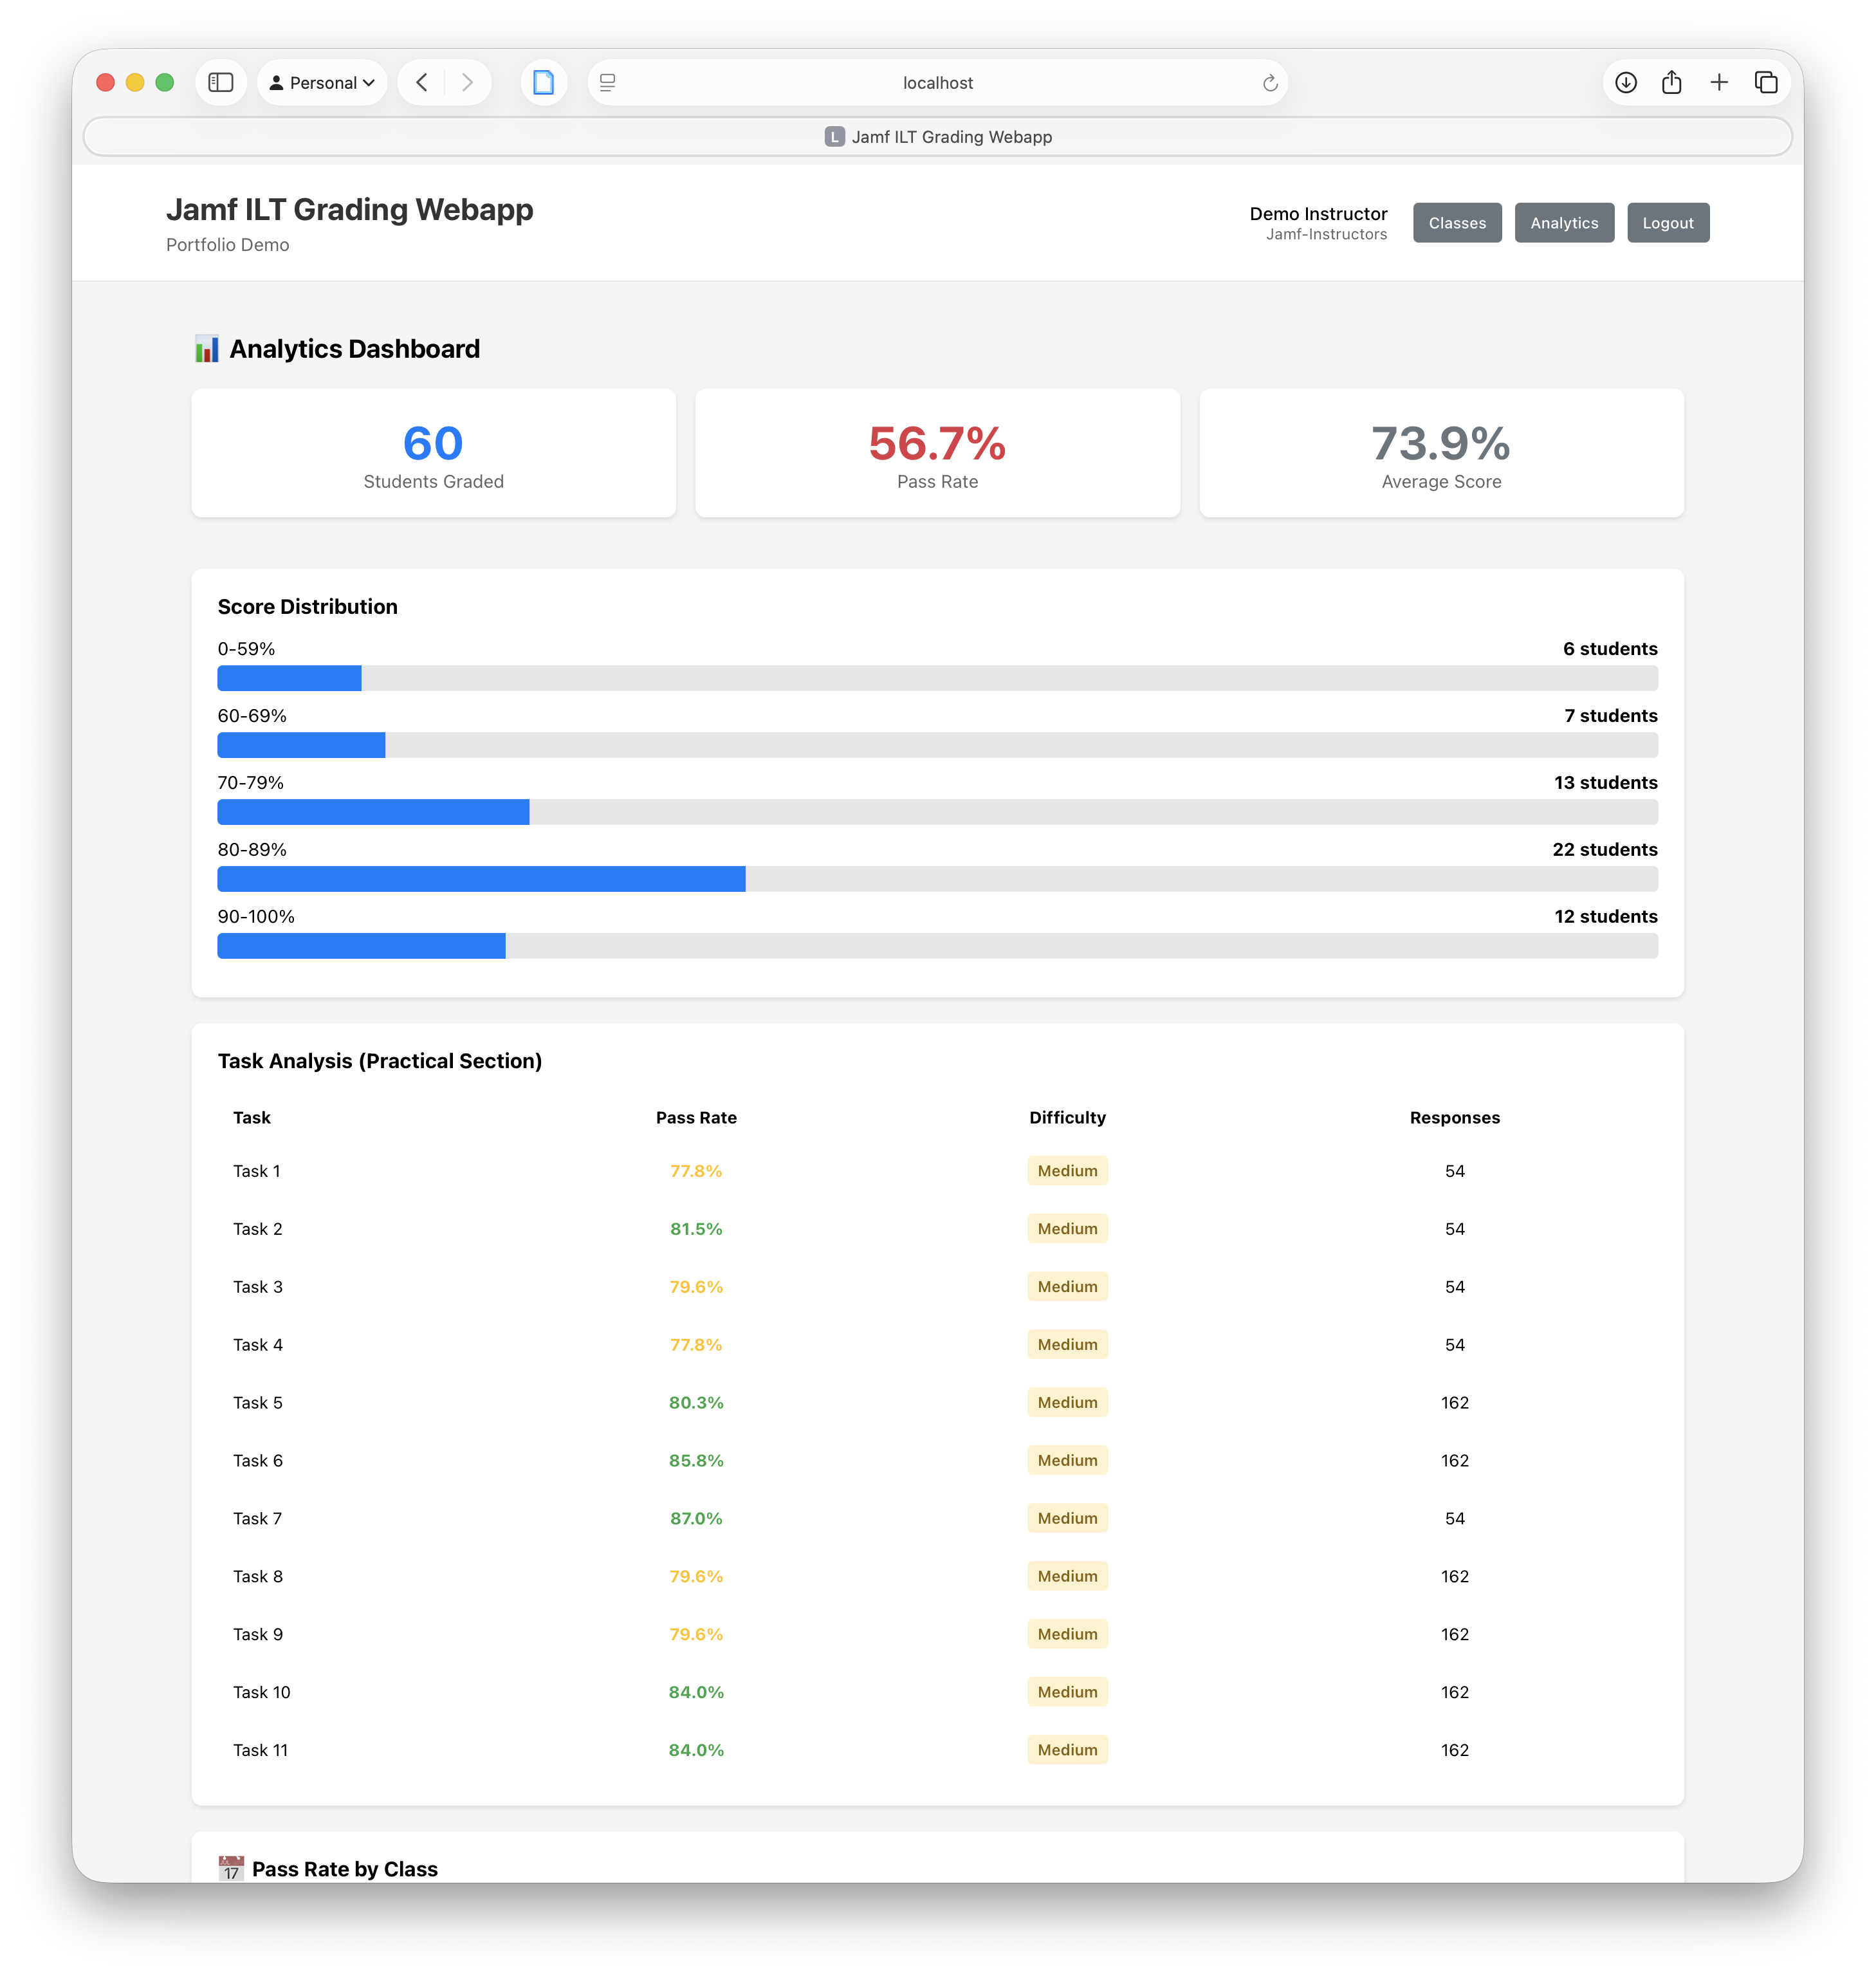
For Everyone: Analytics Dashboard
- Item analysis: Which questions do students struggle with most?
- Task analysis: Performance breakdown by practical task
- Pass rate trends over time
- Export to CSV for statistical analysis in R
Technical Implementation Highlights
Smart Grade Calculation with Atomic Transactions
The grading endpoint validates all rubric items, calculates scores, and saves everything in a single database transaction. If any step fails, nothing is saved—ensuring data integrity.
@router.post("/submit")
async def submit_grade(
    submission: GradeSubmission,
    db: Session = Depends(get_db),
    current_user: CurrentUser = Depends(require_instructor)
):
    # Get active rubric
    rubric = db.query(RubricVersion).filter(
        RubricVersion.is_active == True
    ).first()

    # Validate all items exist
    valid_items = db.query(RubricItem).filter(
        RubricItem.id.in_(rubric_item_ids),
        RubricItem.rubric_version_id == rubric.id
    ).all()

    # Calculate score
    total_points_earned = sum(
        item_points[r.rubric_item_id] if r.passed else 0
        for r in submission.item_responses
    )
    percentage = round((total_points_earned / total_points_possible) * 100, 2)
    passed = percentage >= 80.0

    # Save in single transaction
    db.add(grading_session)
    db.flush()

    for response in submission.item_responses:
        db.add(ItemResponse(...))

    db.commit()
Rubric Versioning System
Each grading session links to a specific rubric version. When rubrics change, historical grades remain accurate because they reference the rubric that was active when the student was graded.
CREATE TABLE rubric_versions (
    id SERIAL PRIMARY KEY,
    version_number VARCHAR(10) NOT NULL UNIQUE,
    effective_date DATE NOT NULL,
    is_active BOOLEAN DEFAULT true,
    total_points INTEGER NOT NULL DEFAULT 45
);

CREATE TABLE grading_sessions (
    id SERIAL PRIMARY KEY,
    rubric_version_id INTEGER NOT NULL
        REFERENCES rubric_versions(id),
    total_points_earned INTEGER NOT NULL,
    total_points_possible INTEGER NOT NULL,
    percentage NUMERIC(5,2) NOT NULL,
    passed BOOLEAN NOT NULL
);
Live Demo (Proof of Concept)
Try the POC: webgrader.christopherlayton.org
This is a proof-of-concept application demonstrating the full grading workflow, analytics dashboard, and rubric management features. The POC is built with mock data to showcase scalability across all Jamf instructor-led training courses.
Impact
Time Savings
- Reduced grading time from 30 minutes to 20 minutes per student (10-minute savings per student)
- Currently supports: 600 students annually (40 classes × 15 students per class)
- Annual time savings: 100 instructor hours (10 minutes × 600 students)
Data-Driven Curriculum Improvement
- Real-time analytics showing which exam items students struggle with most
- Instructional designers can identify curriculum gaps
- Item difficulty analysis informs content updates
Research Support
- CSV export functionality supports my doctoral dissertation research
- Historical rubric versioning ensures data accuracy across cohorts
- Audit logging tracks all grading activities
Stakeholder Reception
- POC demo ready for leadership review
- Positioned for production deployment with Okta SSO and Salesforce integration
- Scalable architecture designed to support all Jamf ILT training classes
What I Learned
Balancing Competing Needs
You might expect the hardest part was writing the code. And yet, the real challenge was designing for three different user types with conflicting priorities. Instructors wanted speed and simplicity. Designers wanted detailed analytics. Admins wanted audit trails and historical accuracy. The rubric versioning system solved this—that is, it let us update criteria without breaking past grading data.
Atomic Transactions Matter
Early on, I realized partial saves could create chaos. If the grade saves but item responses don't, the score becomes meaningless. Wrapping everything in a single database transaction meant either everything saves or nothing does—no corrupted data.
Small Improvements, Big Impact
Reducing grading time by 10 minutes per student doesn't sound like much. But multiply that by 600 students per year, and suddenly instructors get back 100 hours annually. That's time they can spend mentoring students instead of manually calculating scores.
The Value of a Good POC
Building this as a proof-of-concept with Docker meant stakeholders could actually see it working. Mock data, realistic workflows, and a polished UI made the difference between "interesting idea" and "let's fund production deployment."
Future Improvements
This proof-of-concept was designed with scalability in mind. Planned enhancements include:
Expand to All Jamf ILT Classes
- Currently built for Jamf 300, but the architecture supports all 6 instructor-led training courses
- Rubric versioning system allows each course to maintain independent grading criteria
- Multi-course dashboard would enable instructors to grade across different certifications
Advanced Analytics & Research Export
- Add R programming language export functionality for statistical analysis
- Enable instructors and researchers to export grading data in formats compatible with R, Python, and SPSS
- Support longitudinal studies tracking student performance across multiple courses
- Generate automated reports for curriculum improvement recommendations
Integration Enhancements
- Direct Salesforce API integration (eliminating manual data entry)
- Okta SSO for enterprise authentication
- LMS integration for automatic grade synchronization
These improvements would transform the POC into a comprehensive learning analytics platform supporting all Jamf certification programs.